
Target Dial Insights is a report under your Insights tab. This screen shows what happened each time Ringba dialed your targets and ring tree targets over a date range you choose. Use it to spot targets that don't answer, return busy or error, or lose calls, and to compare targets, buyers, and campaigns. You can export this table as a CSV.
This feature is available to admin and report access users. It is included in all Ringba subscription plans: Business, Professional, and Enterprise.
This article contains the following sections:
Target Dial Insights Report Screen
To open the Target Dial Insights report, click Insights > Target Dial Insights in the left navigation bar.
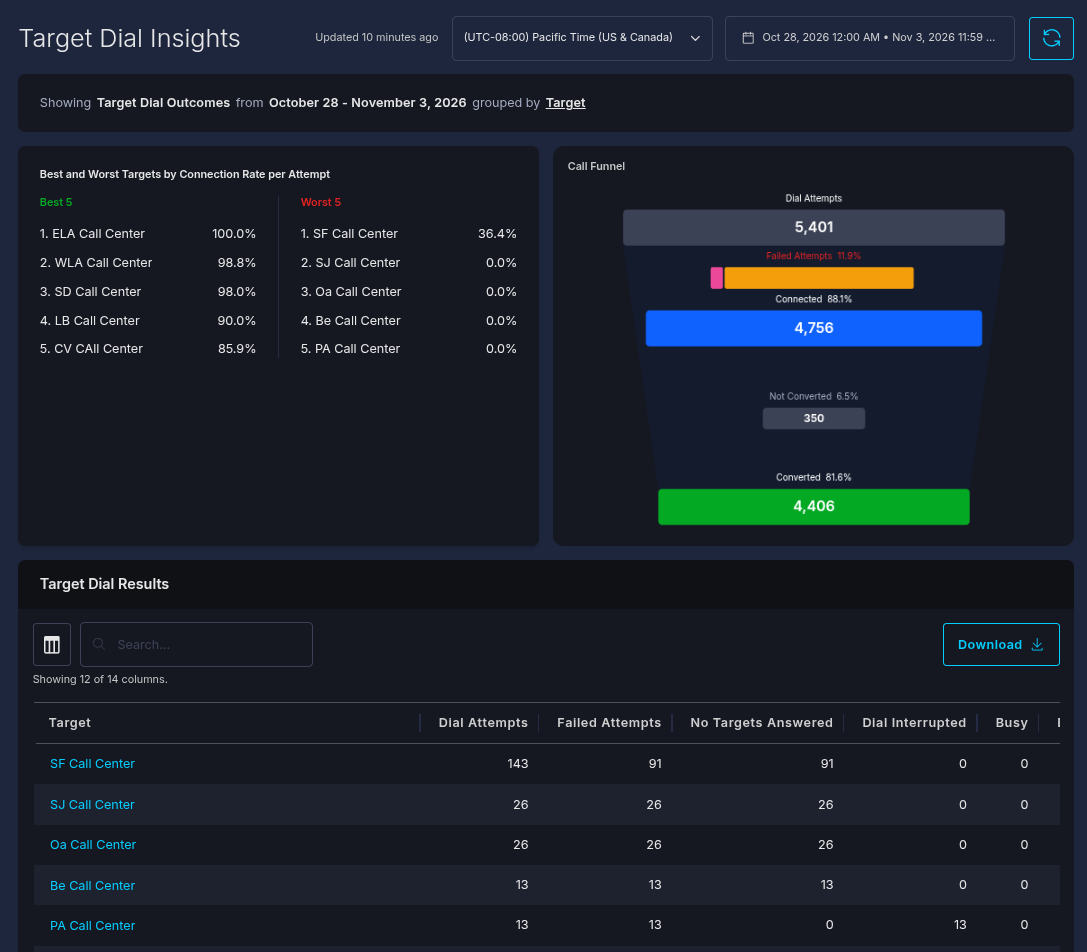
Configuring the Report
Use the tools at the top right of the screen to set up the report.

You see the following tools:
- Time Zone: Select the time zone for the dates and times you see on the report.
-
Date Range: Select the date range of the data you want to see in the report, up to 31 days.
Note: If the date range you choose starts before dial data is available, the report starts on the earliest date that has data and a message tells you that date. - Refresh: Click the refresh button to reload the report with the latest data.
Below the filters, you see a line of text like the following:
Showing Target Dial Outcomes from [your dates] grouped by [your grouping].
Click the underlined grouping to change how the Target Dial Results table at the bottom of the report breaks down its rows. You can choose the following options:
- Target: One row per target. This is the default.
- Buyer > Target: One row per buyer, with that buyer's targets beneath it. Targets with no buyer are grouped under No Value.
- Target > Date: One row per target, with a row for each day beneath it.
- Target > Campaign: One row per target, with a row for each campaign that dialed it beneath it.
- Campaign > Target: One row per campaign, with the targets it dialed beneath it.
With a two-level grouping, expand a group's row to see the rows beneath it. The group's row shows its totals. Where a rate can't be calculated for the group as a whole, the cell shows a dash (—).
The list of columns in the Target Dial Results table appear later in this article. The grouping you choose does not affect the Best and Worst Targets by Connection Rate and Call Funnel sections.
Best and Worst Targets by Connection Rate per Attempt Section
The top-left section of the report is the Best and Worst Targets by Connection Rate per Attempt.
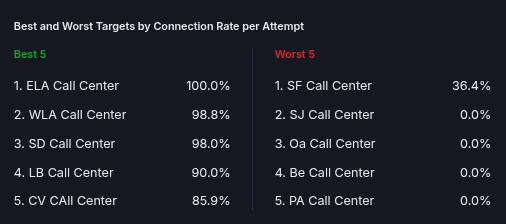
This section lists the five targets that connect most often and the connection rate for each. On the right, you see the list of the five targets that connect least often. A target never appears in both lists, so if your account dialed only a few targets, the Worst 5 list can have fewer than five.
Note: The connection rate you see in this graph includes dial attempts (connected attempts divided by all dial attempts). On the other hand, the Connection Rate column in the Target Dial Results table counts calls instead, so the two can differ for the same target.
Call Funnel Section
The Call Funnel section starts with the total dial attempts at the top of the funnel and follows every dial attempt in the date range down to its conclusion. Each percentage is a share of the total dial attempts.
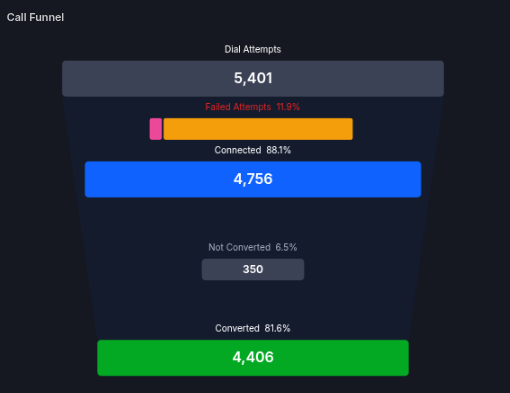
The Call Funnel includes the following data:
- Dial Attempts: The total number of times Ringba dialed your targets.
- Failed Attempts: The attempts that didn't connect. The bar is split by reason: Dial Interrupted, No Targets Answered, Busy and Error.
- Connected: The attempts that connected to a target.
- Not Converted: The connected attempts that didn't convert.
- Converted: The connected attempts that converted.
Target Dial Results Section
The Target Dial Results table includes a row for each group you selected in the grouping statement at the top of the report. You can expand many of the rows in this report by clicking on them. You can control which columns appear in the table, search for rows using the search bar, and download the report as a CSV By clicking the Download button.
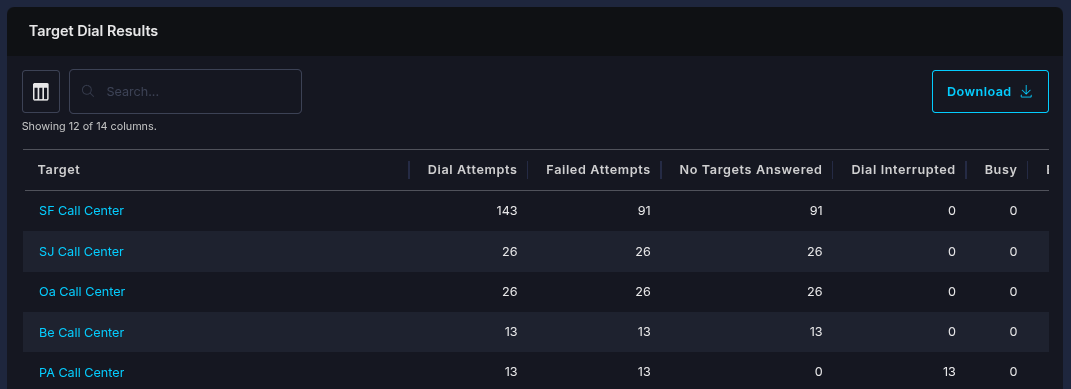
The table contains the following columns:
- Target: The target's name. Click it to open the target.
- Target ID: The target's ID. Hidden by default.
- Buyer: The buyer the target belongs to, or No Value if it has none. Hidden by default.
- Dial Attempts: The number of times Ringba dialed the target. One call can dial the same target more than once, so this counts attempts, not calls.
- Failed Attempts: The attempts that didn't connect. This is the sum of No Targets Answered, Dial Interrupted, Busy and Error.
- No Targets Answered: The attempts where the target rang until the dial timed out, or rejected the call before answering.
-
Dial Interrupted: The attempts that ended before the target answered or failed, so no outcome was recorded. This happens when:
- Several targets ring at once and one answers. Ringba hangs up on the others. On accounts that dial targets simultaneously, this is usually most of the column.
- The caller hangs up while the target is ringing.
- The call is rerouted before the target answers or fails.
Busy: The attempts where the target returned a busy signal.
- Error: The attempts that failed for any other reason, such as a number that isn't in service or a carrier or SIP failure.
- Connected: The attempts that connected to the target.
- Converted: The connected calls that converted.
- Connection Rate: The share of calls that dialed the target and connected to it. A call that dialed the target more than once counts once.
- Conversion Rate: Converted calls divided by connected calls.
- Failure Rate: Failed attempts divided by dial attempts.
-
Avg Call Length: The average length of the target's completed calls, measured from when the call came in.
Note: This call length starts when the call arrives, not when it connects to a target. It averages the full length of each completed call, so it includes any IVR, routing and ringing time before the target answered.
Every dial attempt ends in exactly one outcome, so Dial Attempts always equals Failed Attempts plus Connected. A dash (—) in a rate or average means there is nothing to measure, for example a conversion rate for a target with no connected calls.
Finding Targets That Are Failing
The most obvious way to use this report to find failing targets is to check the Worst 5 list at the tope for the targets that connect least often.
However, you can also sort the Target Dial Results table by the Failure Rate or Failed Attempts field to bring failing targets to the top of the list. For each target near the top, check these columns:
- No Targets Answered: The target rang until the dial timed out, or rejected the call before answering. Check with the buyer that enough agents take calls during the target's hours, and lower the target's concurrency cap if it's higher than they can answer.
- Busy: The buyer's line was busy, usually because all its agents or lines were in use. Ringba's own concurrency caps don't cause Busy, because a target at its cap isn't dialed. Lower the target's concurrency cap to what the buyer can take, or ask the buyer for more capacity.
- Error: The dial failed for another reason, such as a number that isn't in service, an invalid number, or a carrier or SIP failure. Check the target's number or SIP settings, and place a test call to it.
- Dial Interrupted: Often expected on simultaneous dials. See the FAQ below.
From here, you can click the target's name to open it and update its settings.
Target Dial Insights FAQ
Why is my Dial Attempts number higher than the number of calls?
One call can dial the same target more than once, for example when a target is retried or a ring tree falls back to it. Each dial counts as an attempt. Connected and Converted can still be read as calls, because a call connects to only one target.
Why does a target's connection rate in the Best and Worst chart differ from the table?
The chart counts dial attempts: connected attempts divided by all attempts. The table's Connection Rate counts calls: a call that dialed the target three times counts once. A target that is often retried has a higher rate in the table than in the chart.
Why is Dial Interrupted so high on my account?
If your account dials several targets at once, every target that was still ringing when another answered is counted under Dial Interrupted. This is expected and doesn't mean the target failed.
Why is Avg Call Length longer than the time my buyer spent on the call?
Avg Call Length starts when the call comes in to Ringba, not when the target answers. It includes any IVR, routing and ringing time.
Why doesn't the report start on the date I chose?
Dial data isn't available before a certain date. When your date range starts earlier, the report starts on the first date with data and shows a message with that date.
Why do I see a message that some rows are missing?
A grouping can have more rows than one report can return. The rows you see are complete, but the funnel and group totals include only those rows. Choose a shorter date range or a grouping with fewer rows.
What should I do if I need help?
If you have any questions or need additional help, please reach out to our support team via chat or email at support@ringba.com.